
KIMCHI (Aura Final Boss) is a highly volatile meme token running on Solana. Its primary price driver right now is not protocol revenue, product usage, or calculable cash flow. It is the Aura Final Boss narrative, community propagation, short-term capital, and trading pool liquidity.
My assessment is clear: KIMCHI can be observed as a high-risk short-term speculative target, but at this stage there is not enough evidence to support treating it as a long-term value investment. Before investing, the most important thing is not predicting how much higher it can go, but confirming which contract you are actually researching and determining whether real liquidity is sufficient to support an exit.
As of October 21, 2026, the target contract locked in for this article is:
Am8iBffqgaedfdK5XhtorbcRrKzwH9nyL3ySikQfpump
At the same time, other Solana tokens using the "Aura Final Boss" or "KIMCHI" name also exist in the market. Their contracts, market caps, and trading volumes are not the same, and data cannot be used interchangeably.
Risk Disclosure: This article is for project research and investment education and does not constitute investment advice. Meme tokens can lose most or all of their value in a short period. The price, volume, liquidity, and holder data cited here are dynamic snapshots and must be re-verified before trading.
Core Conclusions: 7 Things to Know Before Investing in KIMCHI
- KIMCHI is first and foremost an attention-driven meme asset, not a project token with a validated business model.
- The target mint for this article is
Am8i…pump; multiple same-name tokens exist in the market, and searching by name is insufficient to confirm the asset. - "The betting wallet used by Kimchi in Faxuty's livestream" is a narrative adopted by token metadata and third-party pages. Currently there is insufficient evidence to prove that the streamer, platform, or related entities officially issued or endorsed this token.
- The October 21, 2026 market snapshot shows the target KIMCHI once drew down approximately 90% within a single day, demonstrating that liquidity and new buyer inflow can reverse rapidly.
- Different platforms report significantly different statistics on liquidity and top-10 holder percentages. The statistical timing, address classification, and trading pool scope must be verified.
- High volume only proves active turnover. It does not prove sustained long-term capital inflow, nor does it guarantee a low-slippage exit.
- For beginners, I do not recommend chasing pumps or taking heavy positions. For experienced traders, position sizing should still be determined by maximum acceptable loss.
1. Which Token Is KIMCHI Exactly? Confirm the Contract First, Then Discuss Investment Value
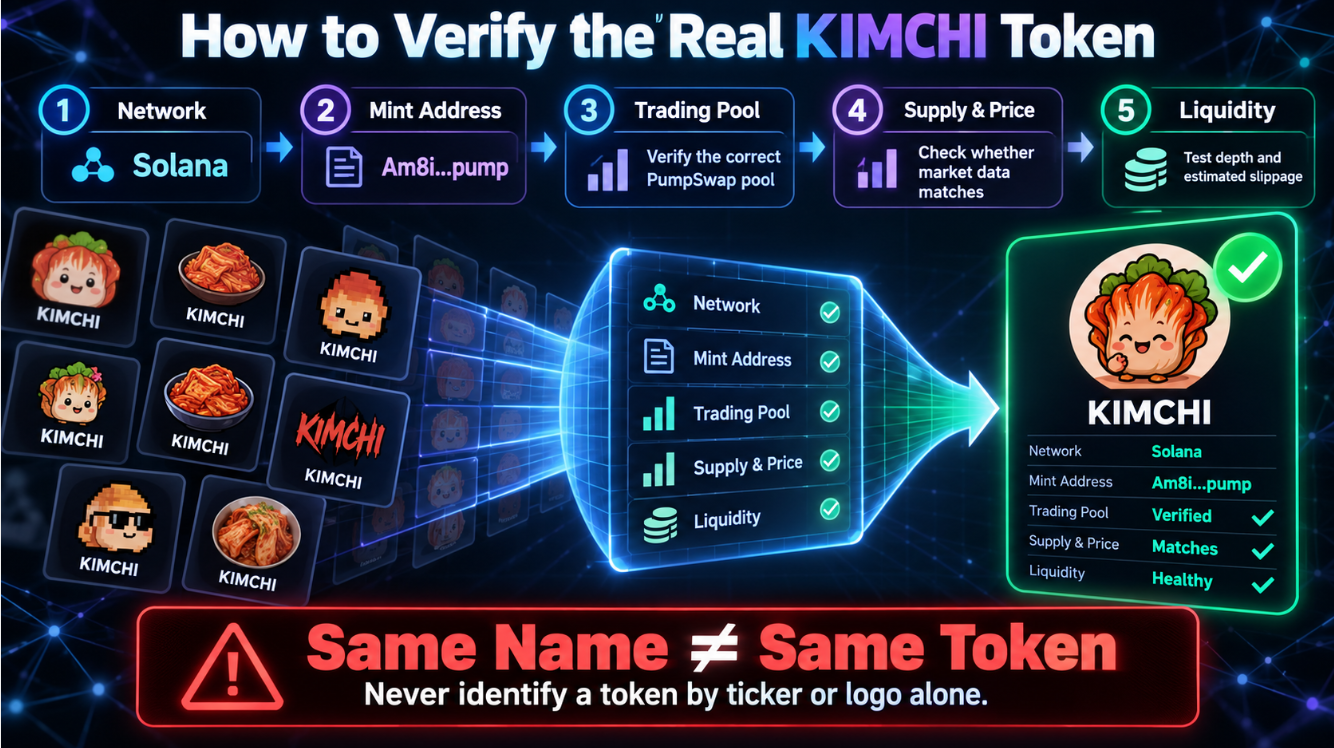
When searching for "kimchi coin" or "kimchi crypto," users will encounter multiple assets with the same or similar names. Creating identical names and tickers on Solana is not difficult, so the name, logo, and even social media avatar cannot prove token identity.
What Is the Target Contract for Aura Final Boss?
The target of this article is Aura Final Boss (KIMCHI) on Solana.
Key verification details:
- Token: Aura Final Boss (KIMCHI)
- Network: Solana
- Mint Address:
Am8iBffqgaedfdK5XhtorbcRrKzwH9nyL3ySikQfpump - Token Program: Token-2022
- On-chain Supply: Approximately 990.2 million
- Mint Authority: Disabled
- Freeze Authority: Disabled
- Primary Markets: PumpSwap and other Solana on-chain trading pools
Solana Explorer shows that this contract uses Token-2022, with a fixed on-chain supply of approximately 990,237,376.705385 tokens and 6 decimal places. Third-party market data platforms typically round the maximum supply to 1 billion, so the two figures are not necessarily contradictory.
How Significant Is the Risk of Same-Name Tokens?
On the same day, at least two different Aura Final Boss pages could be found on CoinGecko. One corresponded to this article's Am8i…pump, with a market cap of approximately $410,000 at the time. The other corresponded to `CSocn…m7pump`, with a market cap of approximately $35.1 million at the time. The difference between the two is nearly two orders of magnitude.
If the latter's price, volume, or all-time high were written into an analysis of the former, the entire valuation conclusion would be invalidated. This is precisely why the research sequence must be:
Network → Full Contract → Primary Trading Pool → Supply → Price and Liquidity
Rather than first searching "KIMCHI price" and assuming the top-ranked result is the target asset.
How to Avoid Buying Same-Name or Counterfeit Tokens?
At minimum, complete the following checks before trading:
- Cross-verify the full Mint Address from multiple public sources. Do not rely on abbreviated addresses.
- Confirm that the network displayed on the trading page is Solana.
- Check the counterpart asset and pool address in the target trading pool.
- Compare whether price, supply, and holder count are roughly consistent.
- Do not open so-called "official buy links" directly from unfamiliar DMs, comment sections, or search ads.
- Test the transaction with a very small amount first, then confirm the received token contract.
If the target contract cannot be confirmed, the most reasonable decision is not to keep guessing. It is not to trade.
2. What Is the Aura Final Boss Narrative? What Story Is KIMCHI Actually Trading?
Multiple market data pages describe KIMCHI as "the betting wallet used by Kimchi in Faxuty's livestream." This story compresses an internet personality, a livestreaming scenario, and high-risk trading culture into an easily spread meme.
But three layers must be distinguished:
- Token metadata or third-party pages adopt this description.
- The community propagates content around this description.
- Kimchi, Faxuty, or related platforms officially issue, collaborate on, or endorse the token.
The first two layers are relatively easy to verify. However, there is insufficient reliable evidence to support the third layer. Therefore, the article cannot rewrite "community-associated narrative" as "official partnership."
Why Can This Story Become a Price Catalyst?
Meme propagation efficiency typically comes from four factors:
- Whether the narrative can be explained in one sentence.
- Whether it relates to an existing internet personality or cultural scene.
- Whether the community is willing to produce secondary content.
- Whether it can continuously bring in new independent buyers.
KIMCHI's story is short, highly recognizable, and carries gambling and "high-risk player" cultural elements, making it easy to enter the attention range of Solana meme traders. But easy propagation does not equal sustainability. Once the story stops generating new content, the price must find new sources of buying pressure.
If There Are No Sustained New Stories, What Remains for KIMCHI?
There is currently insufficient evidence to prove that KIMCHI has an independent product, stable revenue, irreplaceable token utility, or long-term cash flow. Therefore, its value anchor mainly comes from:
Attention × Community Propagation × New Buyers × Liquidity
This model can support short-term price action, but it is difficult to provide a long-term valuation floor comparable to stock cash flow, DeFi protocol revenue, or network fees.
3. Why Does KIMCHI Experience Violent Volatility? How Do Solana Meme Coins Amplify Price Movements?
Early meme token trading is typically concentrated in a small number of automated market-making pools. Price is not determined by a large order book but by the ratio of the two assets in the pool.
When the pool is shallow, a small buy can noticeably push up the price. Similarly, early holder selling can quickly drain the quote asset and cause significant drawdowns.
Fast Upside Does Not Mean Strong Capital Absorption Capacity
Investors often conflate three concepts:
- Price increase: the latest traded price rises.
- Market cap increase: the estimated value of the latest price multiplied by circulating supply increases.
- Real capital inflow: the funds actually invested by buyers.
A $1 million increase in market cap does not mean $1 million in net capital actually entered. In a shallow liquidity environment, relatively small capital can push up the last traded price, causing the entire supply to be valued at a higher price.
Why Do Chase Buyers Bear Higher Risk?
After a rapid price increase, early holders typically have lower costs and larger unrealized gains. Subsequent buyers must not only judge whether the story can continue to spread but also bear the risk of early positions being cashed out.
Once new buying pressure declines, risk transmits along the following path:
Fewer new buyers → Early holders sell → Liquidity under pressure → Slippage widens → More people exit → Price accelerates downward
In the October 21, 2026 market snapshot, the target KIMCHI once fell nearly 90% within 24 hours. This is not a prediction of future price action, but it fully demonstrates that even with active trading, the market can complete a switch from chasing pumps to concentrated exits within a single day.
4. KIMCHI Has High Volume. Why Am I Still Not Directly Bullish?
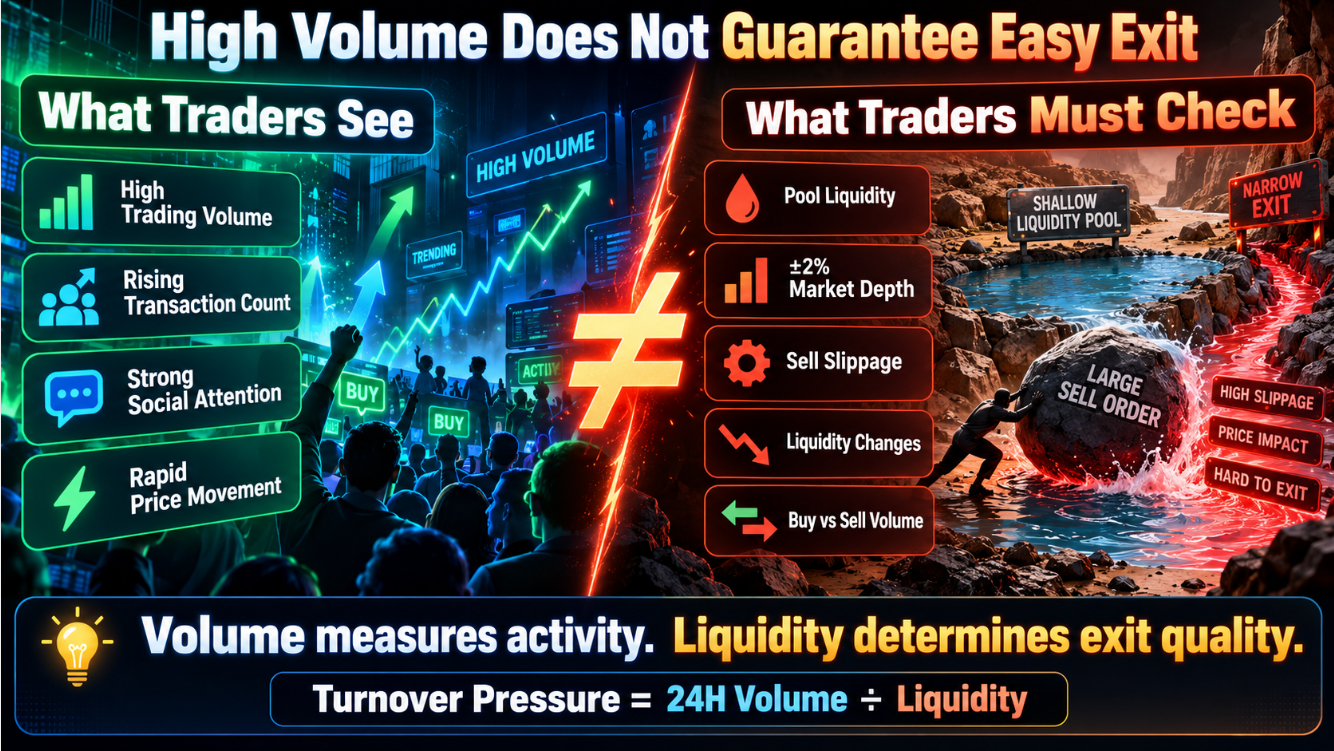
As of October 21, 2026, different platforms displayed the target KIMCHI's 24-hour volume at approximately $920,000 to $2.6 million. Differences may arise from update timing, covered trading pools, and aggregation methods.
Rather than picking the largest number to advertise "hot market conditions," a more reasonable approach is to explain the data methodology and use data from the same time and same trading pool for comparison where possible.
What Are Volume, Liquidity, and Market Cap Respectively?
- Volume: shows how much buying and selling occurred over a period. It cannot prove sustained net capital inflow.
- Liquidity: shows the market's ability to absorb trades and control slippage. It cannot guarantee liquidity will not be withdrawn.
- Market Cap: latest price multiplied by circulating supply. It does not mean equivalent capital was invested.
- Holder Count: number of holding addresses. It does not mean all are independent long-term investors.
- Top 10 Share: concentration of top addresses. These addresses cannot all be treated as whales before classification.
The following auxiliary indicator can be used to observe turnover intensity:
Volume/Liquidity Ratio=Current Liquidity24-hour Volume\
For example, Phantom at the time showed approximately $2.6 million in volume and approximately $164,000 in liquidity, corresponding to a ratio of about 15.9. Jupiter at another time point showed approximately $2.31 million in volume and approximately $41,000 in liquidity, a ratio exceeding 50.
This is not a "higher is better" indicator. An extremely high ratio may represent either market activity or significant tension between bots, high-frequency turnover, and limited liquidity.
±2% Depth Is Closer to Actual Experience Than Total Liquidity
CoinGecko's target market snapshot showed that the primary PumpSwap market had only about $1,600 in buy and sell depth within ±2% of the current price. This tells investors that even if the page displays tens of thousands of dollars or more in pool liquidity, the amount actually close to the current price that can be traded with relatively small impact may still be limited.
Therefore, traders planning to invest $100, $1,000, and $10,000 face different markets. The larger the position, the more estimated slippage and exit costs cannot be ignored.
Why Can High Volume Still Correspond to Net Selling?
Jupiter's snapshot once showed approximately $996,000 in buys versus $1.32 million in sells, with net flow skewed toward sellers. During the same window, holder count still increased by approximately 4.13%, but liquidity declined by approximately 66.44%.
This combination is highly educational:
Rising holders cannot offset selling pressure. Active volume cannot prevent liquidity deterioration.
5. Is KIMCHI's Holder Structure Safe? How Should Top-10 Holder Percentages Be Interpreted?
Phantom's October 21, 2026 page snapshot showed the target KIMCHI had approximately 5,629 holders, with the top 10 addresses accounting for approximately 87.77%. Metaplex at another time point showed top-10 concentration at approximately 77.54%, and other on-chain analytics pages even showed the largest address accounting for approximately 70.7%.
These figures cannot be simply averaged, nor can the lowest figure be cherry-picked. Differences typically arise from:
- Whether liquidity pool addresses are counted as holders.
- Whether program addresses or special accounts are identified.
- Whether burn or locked addresses are excluded.
- Different data update times.
- Different address classification algorithms.
Does High Concentration Necessarily Mean Project Team Manipulation?
Not necessarily. A large address could be a trading pool, custody address, program account, or aggregator. However, before address classification is completed, high concentration at least means investors need further investigation rather than directly declaring "healthy token distribution."
The correct analysis steps are:
- Obtain the top 20 holder addresses.
- Label liquidity pools, trading platforms, program accounts, and regular wallets.
- Observe the first buy time and cost of regular large holders.
- Check whether tokens are continuously being transferred into the primary trading pool.
- Determine whether multiple wallets may have related funding sources.
Which Changes Would Directly Lower My Assessment?
- Early large wallets continuously transferring tokens into the trading pool.
- Top regular wallets holding very high percentages without reasonable explanation.
- Selling primarily coming from a small number of low-cost addresses.
- Large holder balances declining rapidly while liquidity also falls.
- Volume appearing high but primarily contributed by a small number of accounts.
Holder count is a surface indicator. Token distribution and selling capacity determine real risk.
6. Does KIMCHI Have Long-Term Value? Or Does It Mainly Rely on Attention and Liquidity?
Long-term value investing typically requires some verifiable source of value, such as corporate earnings, protocol revenue, network fees, asset backing, or clear usage demand. Current public information is insufficient to prove that KIMCHI has established any of these.
Therefore, analyzing KIMCHI is more appropriate using an "attention asset" framework.
Key dimensions to examine:
- Meme Strength: Is the story easy to understand and repeatedly spread?
- Community: Does it continuously produce original content and new participants?
- Liquidity: Can buys and sells be completed with acceptable slippage?
- Distribution: Are regular large holders excessively concentrated?
- Momentum: Do new buyers, volume, and price confirm each other?
If its primary demand always comes from "expecting later buyers to buy at higher prices," then long-term valuation lacks a stable anchor. Even if KIMCHI may still experience significant rebounds in the future, that cannot be used to infer it is suitable for long-term dollar-cost averaging.
7. What Is KIMCHI's Upside Logic? Building a Verifiable Judgment Model
KIMCHI's true bullish logic can be compressed into four gates:
Sustained Narrative → Growing Real Buyers → Improving Liquidity → Sustained Price Absorption
All four conditions are indispensable.
Bull Case: When Is It Worth Increasing Attention?
- The target contract's identification gradually becomes consistent across major platforms.
- Independent buyers and new holders grow continuously.
- Primary trading pool liquidity and ±2% depth improve simultaneously.
- Community discussion persists for weeks rather than exploding and fading within a day.
- Early regular large holders do not concentrate on cashing out.
- KIMCHI still shows relative strength during market pullbacks.
Even if these conditions hold, they only indicate that short-term or swing logic has improved. They do not automatically prove long-term value.
Base Case: The More Common Path for Most Meme Coins
- Initial hype declines.
- Volume returns to normal.
- A small number of core community members remain active.
- Price repeatedly turns over within a high-volatility range.
- Occasional pulse-like rebounds are triggered by social events.
In this scenario, trading opportunities may exist, but the opportunity cost of continued holding is high.
Bear Case: Which Signals Mean the Logic Has Failed?
- Price rises but independent buyers decline.
- Volume remains high but depth near the current price continues to fall.
- Early large holders continue selling.
- Community content reduces to price targets and shilling.
- Same-name tokens or newer memes steal attention.
- The broader market turns Risk-Off and small-cap capital rapidly withdraws.
For KIMCHI, the biggest competitor may not be another "Kimchi" but the next hotter, more easily spread meme.
8. When Is KIMCHI Worth Observing? When Would I Simply Give Up?
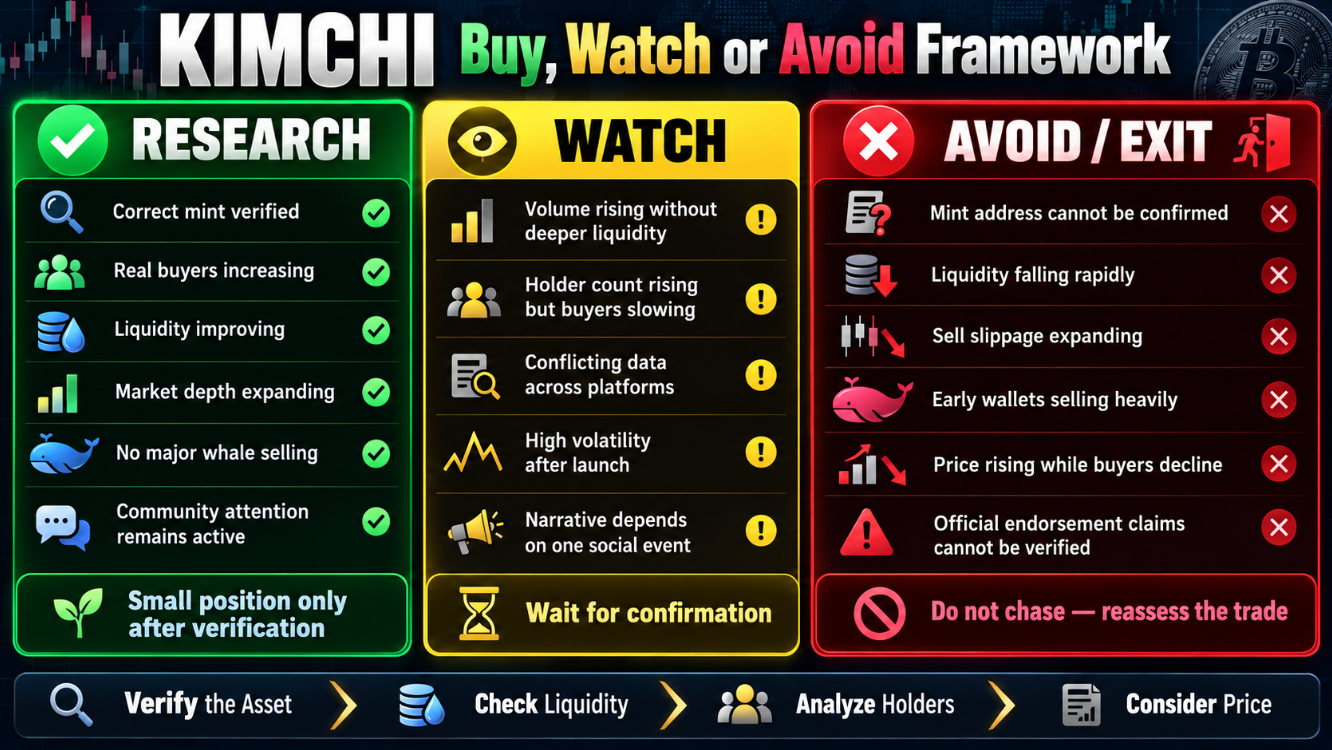
- If the contract address cannot be confirmed, there is no research basis. Do not trade.
- If different platforms correspond to different contracts, there is identity confusion. Verify first and do not place orders.
- If volume is high but depth is insufficient, expect high turnover and high slippage. Do not chase pumps.
- If top holdings are high and regular large holders are continuously selling, token distribution risk is high. Avoid.
- If buyers, holders, and depth are growing simultaneously, the data is mutually confirming. Consider a small position for further research.
- If liquidity is declining and sell slippage is widening, exit risk is rising. Reduce risk exposure.
- If price is rising only on a single social hotspot, there is a lack of sustainability. Do not value it as a long-term asset.
- If the official relationship with the project team or related entities is disproven, the core narrative is damaged. Immediately reassess the trading logic.
The most important rule here is: Do not wait for the project to go to zero before acknowledging that the logic has failed. When the buyer growth, liquidity, or community heat that the original thesis relied on no longer holds, the trading rationale has already changed.
9. If Participating in KIMCHI, What Trading Strategy Should Be Used?
Strategy 1: Determine Position Size by Maximum Loss First
Position size should not be determined by "how much it could rise" but by "how much you can afford to lose in the worst case."
Assume an account size of 10,000 USDT and a maximum allowable loss per trade of 1% of the account, meaning 100 USDT. If the token could fall 80% in an extreme scenario, the theoretical position cap is approximately:
Position Cap=100/80%=125 USDT
This is only a capital management example, not fixed advice. Meme coins may be unable to execute stop-losses as expected when liquidity suddenly dries up, so actual risk may be higher.
Strategy 2: Let Liquidity Constrain Position Size
Simulate both buying and selling before placing an order, rather than only looking at the page price. If the planned sell amount would already significantly move the pool price, the position is too large for the current market.
Strategy 3: Confirm in Stages Rather Than Betting All at Once
The planned capital can be divided into:
- Observation position: verify execution, slippage, and asset identity.
- Confirmation position: add only if buyers, liquidity, and narrative continue to improve.
- Trend position: consider only when data continuously confirms each other.
If first-stage data deteriorates, there is no need to initiate the next stage.
Strategy 4: Write Down Exit Conditions in Advance
Exit conditions may include:
- Primary pool liquidity declines significantly.
- Independent buyers continuously decrease.
- Early large holders concentrate transfers into the pool.
- Sell slippage exceeds personal limits.
- The core Aura Final Boss narrative is disproven.
- Broader market risk appetite rapidly weakens.
Strategy 5: Do Not Rewrite Short-Term Losses as Long-Term Conviction
If the buy rationale was hype, momentum, and capital flow, then when these conditions disappear, the position should be reassessed. Starting to look for "long-term value" only after the price falls is usually just refusing to admit that the original trading logic has failed.
10. How Does KIMCHI Differ from STARTUPSI and UPRH? New Coins Cannot Be Ranked by Gains Alone
KIMCHI and What Is STARTUPSI can both use the Solana new coin research framework, but their contracts, narratives, holders, and liquidity must be verified separately. Just because two tokens come from a similar issuance environment does not mean one project's data can be applied to another.
For horizontal comparison, the following can be checked uniformly:
- Whether project identity is clear.
- Whether the core narrative can be verified.
- Whether the primary trading pool has real depth.
- Whether top regular wallets are concentrated.
- Whether new buyers are sustained.
- Whether price increases are accompanied by liquidity improvement.
What Is UPRH can serve as another case study for new asset research. The purpose of comparison is not to pick the fastest-rising token but to train yourself to first identify the asset type and then choose the appropriate valuation method.
11. How Does KIMCHI Differ from DNA? Why Can't the Same Method Be Used to Value Both?
KIMCHI's core variables are attention, token distribution, and liquidity. Product-type tokens like DNA also require analysis of product adoption, token utility, value capture, and future unlocks.
Investors can observe market data through DNA real-time quotes and refer to DNA price prediction to understand market expectations, but any prediction cannot replace analysis of the product and supply-demand dynamics.
Key comparison points:
- Core Driver: KIMCHI is driven by meme, social propagation, and capital flow. DNA-type product tokens are driven by product adoption, token demand, and narrative.
- Primary Data: KIMCHI requires buyers, holdings, liquidity, and volume. DNA-type tokens require users, revenue, unlocks, and value capture.
- Long-Term Anchor: KIMCHI's long-term anchor is currently unclear. DNA-type tokens require verification of the product-token connection.
- Primary Risks: KIMCHI faces attention loss, whales, and slippage. DNA-type tokens face execution, competition, unlocks, and insufficient demand.
Having a product does not guarantee the token will rise. Not having a product does not mean a meme cannot rise short-term. They simply require completely different judgment frameworks.
12. How Do BTC and ETH Market Conditions Affect KIMCHI's Trading Risk?
KIMCHI trades on Solana, but it still belongs to the high-beta risk asset class within the broader crypto market.
BTC price prediction can help determine whether the market is in a Risk-On or Risk-Off environment. When BTC falls rapidly, investors typically prioritize reducing exposure to small-cap and low-liquidity assets, and KIMCHI's new buying pressure and pool liquidity may both come under greater pressure.
ETH price prediction can serve as an auxiliary observation of overall on-chain risk appetite and capital diffusion. ETH strength may indicate the market is more willing to take on smart contract and application-type asset risk, but it is not a direct fundamental for KIMCHI.
It must be made clear:
BTC and ETH are used to judge the market environment and cannot replace scrutiny of KIMCHI's contract, holdings, liquidity, and buyer data.
Even if the broader market rises, KIMCHI may fall due to its own whale selling or fading hype.
13. Nine Risks That Must Be Understood When Investing in KIMCHI
- Same-name asset risk: Identical names may correspond to completely different contracts.
- Narrative misreading risk: Community stories do not equal official endorsement by related individuals or platforms.
- Liquidity risk: The page price does not mean large capital can exit at that price.
- Holding concentration risk: A small number of regular wallets may have an enormous impact on pool price.
- Price discovery risk: Early new coin prices may be extremely unstable.
- Attention migration risk: New hot memes may rapidly steal capital and discussion.
- Data methodology risk: Volume, liquidity, and top holder statistics may differ across platforms.
- Market cycle risk: When BTC, ETH, or SOL weakens, high-beta memes typically come under greater pressure.
- Operational and scam risk: Fake contracts, phishing sites, malicious approvals, and fake customer service can cause irreversible losses.
14. FAQ: The Most Common Questions About KIMCHI
What Is KIMCHI?
KIMCHI in this article refers to the meme token named Aura Final Boss on Solana, with the target mint Am8iBffqgaedfdK5XhtorbcRrKzwH9nyL3ySikQfpump. It is currently primarily driven by community narrative, trading heat, and liquidity.
Are kimchi coin and kimchi crypto the same asset?
Not necessarily. These search terms may return multiple blockchains, multiple contracts, or multiple same-name tokens. The full contract address must be used for confirmation.
What Is Aura Final Boss?
It is the meme name adopted by this KIMCHI token. Multiple pages associate it with Kimchi, Faxuty livestreams, and betting wallet narratives, but the public narrative is insufficient to prove that related individuals or platforms officially endorse the token.
Is KIMCHI a Solana token?
The target contract in this article is a Solana Token-2022 asset. The full Mint Address should still be verified before trading.
What Is KIMCHI's contract address?
The contract studied in this article is Am8iBffqgaedfdK5XhtorbcRrKzwH9nyL3ySikQfpump. Do not verify only the first and last characters.
Why Does KIMCHI Have Different Contract Addresses?
Tokens with the same or similar names can be created on a blockchain. Different communities may also use the same meme. The ticker is not a unique identifier.
Why Does KIMCHI Suddenly Rise or Fall?
Common reasons include social propagation, concentrated new buyer entry, shallow pools, early holder selling, liquidity changes, and overall market risk appetite. A single reason is usually insufficient to explain all volatility.
What Does High KIMCHI Volume Mean?
It indicates active trading, but it does not equal net buying, long-term holding, or sufficient liquidity. It must be analyzed together with independent buyers, sellers, depth, and holding changes.
How Is KIMCHI's Liquidity?
As of October 21, 2026, different platforms showed significant variation, ranging from approximately $40,000 to $160,000. CoinGecko at the time showed the primary market's ±2% depth at approximately $1,600 on each side. Data changes continuously, and the target pool should be re-tested before trading.
What Does High Top-10 Holder Concentration in KIMCHI Mean?
It signals potential concentration risk, but liquidity pools, program accounts, and other special addresses must first be excluded. Without classification, all top addresses cannot be assumed to be project team or whales.
Is KIMCHI Worth Buying?
My judgment: it can be observed as a high-risk short-term target, but it is currently not suitable as a validated long-term value asset. When the contract, depth, and token distribution structure cannot be confirmed, not buying is more reasonable than guessing.
Is KIMCHI Suitable for Long-Term Holding?
There is currently a lack of product revenue, essential utility, or other stable valuation anchors, so the basis for long-term holding is insufficient. If new verifiable utility emerges in the future, it should be reassessed.
How to Determine Whether KIMCHI Has Whale Selling?
Track top regular wallet balances, transfers to the primary trading pool, sell executions, and funding source relationships. Do not look only at total holder count.
15. Final Conclusion: Is KIMCHI Worth Buying?
My judgment: KIMCHI can serve as a high-risk short-term observation target, but at present it should not be treated as a long-term investment asset based solely on the Aura Final Boss narrative, trading volume, or price gains.
The target contract in this article experienced a nearly 90% single-day drawdown on October 21, 2026. During the same period, different platforms showed significantly different statistics on liquidity and top holdings. These phenomena do not automatically prove the project is problematic, but they demonstrate that investors face a market with insufficient price discovery, complex data methodologies, and exit conditions that can change rapidly.
For KIMCHI, I will judge strictly in the following order:
Confirm full contract → Confirm primary trading pool → Check real depth → Classify top addresses → Observe new buyers → Only then look at price
If the target contract is unclear, liquidity cannot support transactions, early holders continue selling, or community heat rapidly declines, I will not chase in just because it is rising.
If subsequent data can prove that real buyers, liquidity, and community attention are improving simultaneously, then short-term opportunities are worth reassessing. But this is still a trade on attention duration, not an investment in validated business value.
Confirm the asset first, then judge liquidity, and finally consider price. The order cannot be reversed.
References and Data Notes
- CoinGecko: Target Aura Final Boss (KIMCHI) Market Page
- Phantom: Target KIMCHI Token Page
- Solana Explorer: Target Mint
- Jupiter: Target KIMCHI Market Data
- Metaplex: Target KIMCHI Asset Page
Data cutoff: October 21, 2026. Dynamic metrics should be updated again before publication and before trading.